Please Wait |
Welcome to the Hookit Mini Support Center & Glossary
Full Support Center
Table of Contents
Key Terminology
Social Media Metrics
Valuation & Promotion
Promotional Effectiveness
Earned Media
Key Terminology
------------------------------------------
HVM (Hookit Valuation Model)
The core model that helps you understand the value you are getting from your partners Learn more
AAV (Adjusted Ad Value)
This is the key output of the HVM and is the "true" value that you are getting from a post, partner or your entire portfolio.
MAV (Max Ad Value)
The potential value each post could drive for your brand. The amount you would have paid if the post was an ad that received the same amount of interactions on the given platform. Calculated as the number of likes, comments, shares, views, etc. multiplied by the cost per engagement (CPE) on that platform. The CPE used is a 30 day running average of daily auction data and actual ad campaigns by brands on each platform.
Promotion Quality
The quality of visuals (logos and products) and text (@mention, # hashtags, keywords, links) for branded posts scored out of 100%. The score is derived from a combination of 6 branding factors (depending on the type of post): position, coverage, clarity, viewership, competition, and crowding.
Promotional Effectiveness Score (aka PE Score)
The Promotional Effectiveness Score is a new Hookit exclusive KPI that evaluates how effective a partner is at promoting a brand. We normalize the scores to put everyone on an even playing field, so the “size” of the entity doesn’t have an impact on the results. This means that partners no matter their audience size or engagement can be directly compared.
Branded
Any time the word Branded is used (branded posts, branded engagement), we are referring to posts or content that include either text (hashtag, mention, keyword) or visual (logo) promotion for your brand.
Entity
Any of the individuals or organizations within the sport and sponsorship ecosystem
- athlete, influencer, entertainer, content producer, team, league, event, venue,
media property, brand.
Sport & Entertainment Graph
Hookit's proprietary digital representation of the sport & sponsorship ecosystem
- the entities and their meta data & connections to other entities.
Hookit is tracking and have mapped nearly 500K entities including 100K+ athletes,
5K+ teams & leagues and 4K media properties
Brand Graph
The brand specific section of the sport & entertainment graph, this is the
key to Hookit benchmarking & proper valuation. There are 10K brands
tracked and mapped with 8K logos trained and 80K brand tags.
Tags
Social Media Terms
------------------------------------------
Total Fans (aka "Followers"):
The total number of social media accounts following an entity during the selected
time frame on platforms currently selected in your filters that the entity is
tracked on.
New Fans (aka "New Followers"):
The number of new social media follower accounts that an entity has gained/lost
over the selected time frame on platforms currently selected in your filters
that the entity is tracked on.
Likes:
The number of times a post has been liked (applicable
to all platforms)
Comments:
The number of times a post has been commented on
(applicable to most platforms). A reply on Twitter counts as a comment.
Shares:
Number of times that a post has been shared (N/A for Instagram and Youtube).
A retweet on Twitter counts as a share.
Interactions (aka Engagements):
Interactions include the likes, comments/replies, and shares/retweets on a post.
Interactions now (as of 2022) include Facebook Reactions. This term is
synonymous with Engagements, a commonly used term referring to the sum of likes,
comments and shares.
Engagement:
Average interactions per post divided by follower count
Video Views:
These are the view counts from videos as defined and supplied by the platforms
Impressions:
These are the impressions as defined and supplied by the platforms. Actual
impressions are only available via accounts Authenticated with Hookit.
Estimated Impressions:
In the case of measuring post impressions from unauthenticated social media accounts,
Hookit uses a proprietary data model to estimate the number of impressions generated
by a post. Estimated numbers will be clearly marked as such.
Interactions per Impressions:
This is a Hookit derived metric where the total interactions are divided by the
total impressions - on a single post or across an aggregate of posts. Other
platforms may refer to this as the impression engagement rate.
Valuation & Promotion Terms
------------------------------------------
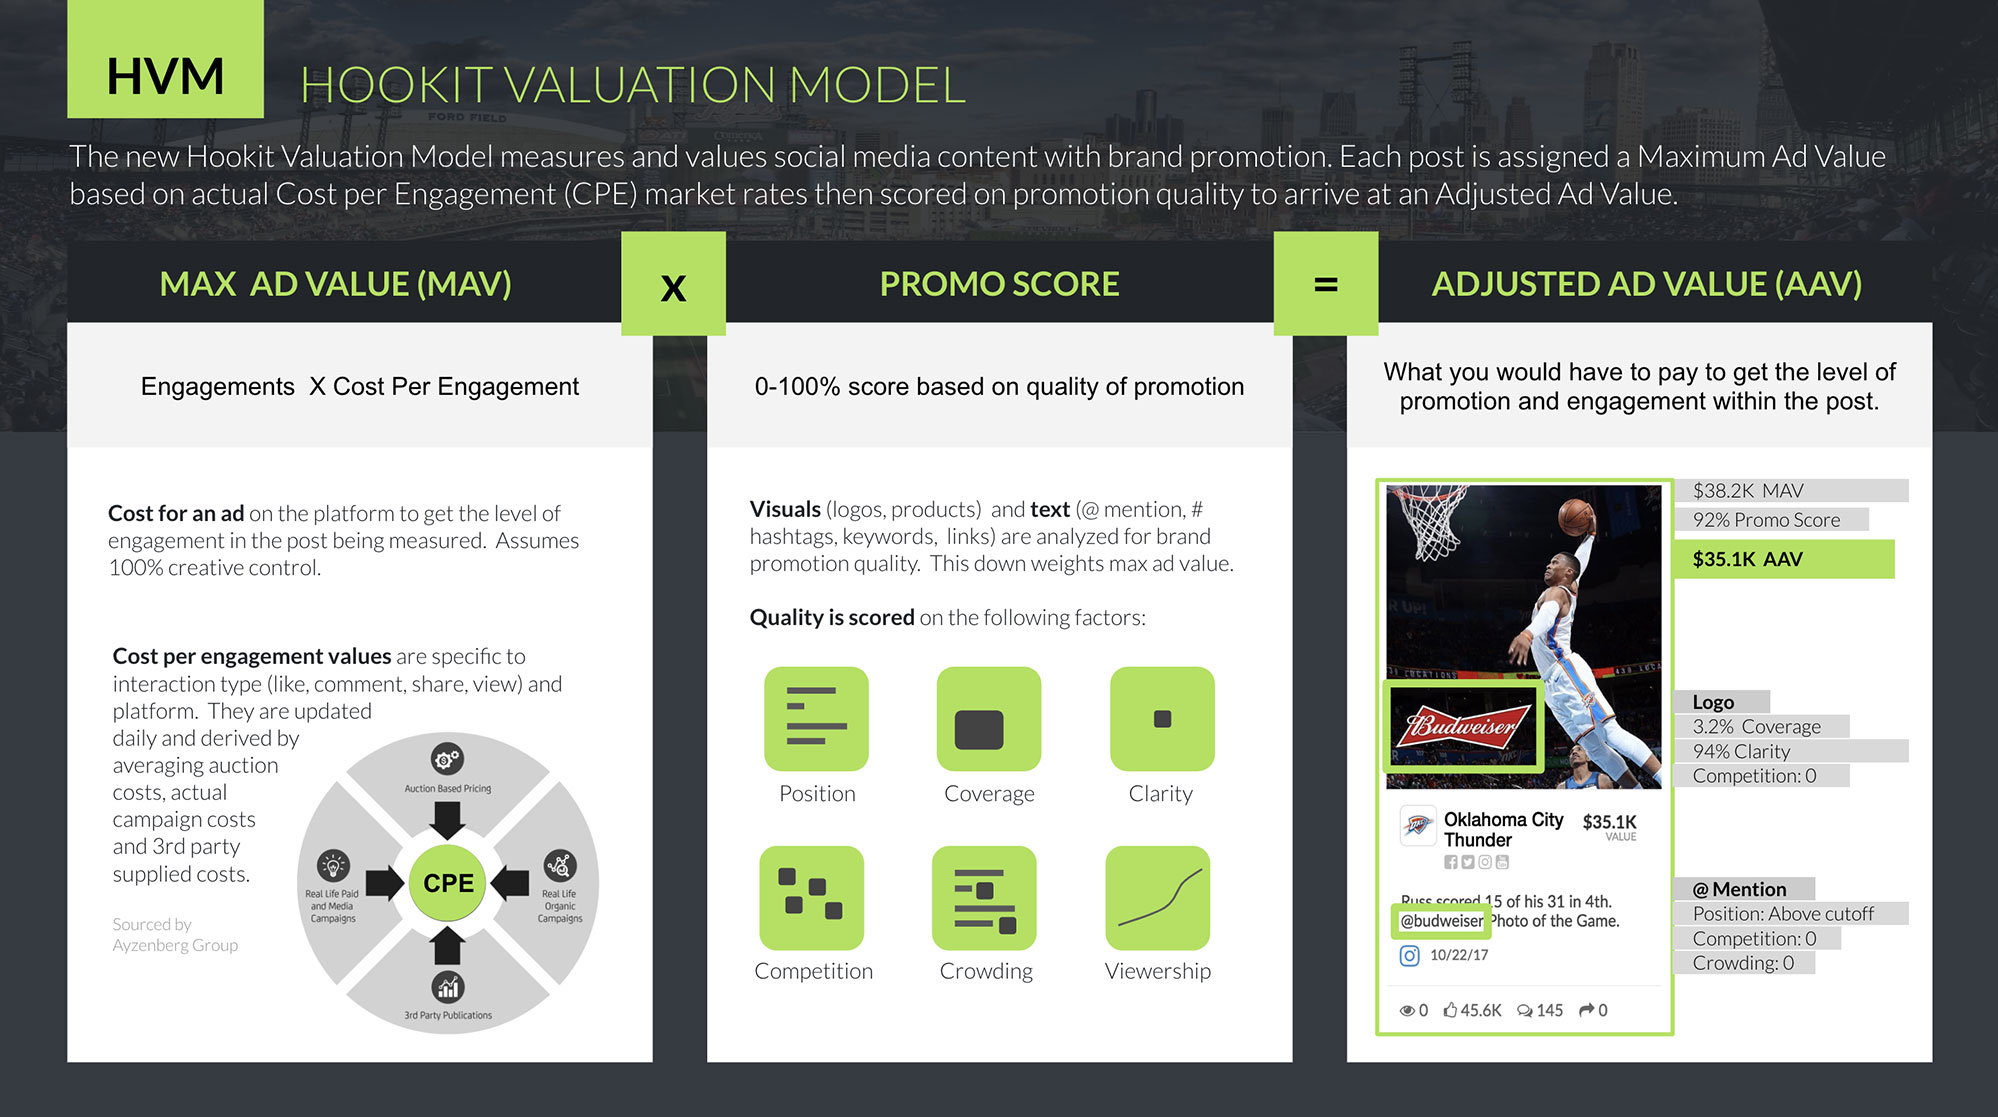
Hookit Valuation Model (HVM):
Measures and values social
media content with brand promotion. First, brand promotion is identified in a
post based on the promo tags mapped to the brand (@, #, logo, etc.). Next,
a Max Ad Value is calculated by multiplying the engagements (likes, comments,
shares, etc) by a Cost Per Engagement or "CPE" - a daily updated value based
on an average of real world ad spend on the platform. The Max Ad Value
(MAV) is what the post would have cost if it were an ad on the platform with
that amount of engagement. We then analyze the promotion to arrive at a
0-100% quality score - the Promotion Quality Score. Finally, we down weight
the MAV to arrive at the AAV - the Adjusted Ad Value. So...
Max Ad Value * Promotion Quality = Adjusted Ad Value
Adjusted Ad Value (AAV):
This is the key metric used in portfolio and partner evaluation as it combines
the amount of engagement the promotion received by the quality of that promotion.
It is the "sponsorship" value of the content.
Max Ad Value (MAV):
The amount you would have paid if the
post was an ad that received the same amount of interactions on the given platform.
Calculated as the number of likes, comments, shares, views, etc. multipled by
the cost per engagement (CPE) on that platform. The CPE used is a 30 day running
average of daily auction data and actual ad campaigns by brands on each platform.
Branded (aka Promoted): Content that includes any promotion
for a brand (or any entity). Non-branded is any post that does not include
promotion for the brand(s) being analyzed.
Promo or Value Tag: Any hashtag, mention, keyword, logo or object
associated with a brand or entity
Text Promotion: an embedded tag, @ mention, # hashtag or keyword.
Visual Promotion: logo or object / product (if it is being valued
for a brand
Deliberate Promotion: This is a post where we can be sure it
was "deliberate" - there is at least one text promotion.
Incidental Promotion: Promotion where there is ONLY visual promotion.
Branded Views: Number of views on all branded videos
Branded Posts: Number of posts promoting your brand by sponsored
entities
Branded Post Ratio: Number of branded posts divided by the number
of total posts
Branded Interactions: Number of interactions from branded
posts by sponsored entities
Branded Interaction Ratio: Number of branded interactions divided
by the number of total interactions
Overall Promotion Quality (aka Promo Quality or PQ):
The quality of visuals (logos and products) and text (@mention, # hashtags, keywords,
links) for branded posts scored out of 100%. The score is derived from a combination
of 6 branding factors (depending on the type of post): position, coverage, clarity,
viewership, competition, and crowding.
Average Promotion Quality:
This is an average of all the promotion qualities on the posts you are reporting
on. The Promo Quality at the very top of the dashboard is an average your
average.
Effective Promotion Quality:
On an aggregate of posts, this is the AAV / MAV. This number will likely
be different than the average Promotion Quality, as it will be skewed by high
MAV posts if they have high or low PQ. This is essentially the weighed
average.
Visual Quality: The percentage of overall quality gained from
visuals on posts
Text Quality: The percentage of overall quality from text on
posts
Promotion Quality Factors
Share of Value: When looking at your portfolio list, this
is a % of an entities AAV divided by total AAV from all entities in the list
you are viewing.
AAV per 10K Followers: The sum of AAV divided by (sum
of followers / 10,000). This derived metric was created to compare partners
and level the playing field a bit to show partners driving high value despite
having smaller follower count. It is a great way to see who is "punching
above their weight". Keep in mind the sum of AAV and sum of followers are
based on your date range and filters.
Value by Platform: The amount of value earned on a specific
social media network
Value by Source: The amount of value earned from a type of entity
Most Valuable Branded Posts: All posts promoting your brand
sorted by value earned
Top Promotions: The top performing tracked promotional
tags sorted by interactions + video views
Promotional Effectiveness Score (aka PE Score)
------------------------------------------
The
Promotional Effectiveness Score is a Hookit exclusive KPI that evaluates how
effective a partner is at promoting a brand. We normalize the scores to put everyone
on an even playing field, so the “size” of the entity doesn’t have an impact
on the results. This means that partners no matter their audience size or engagement
can be directly compared.
It is a 0-100 Score run weekly (every Monday), looking back 90 days from the
previous week (so posts are given a chance to mature). The average is 50, so
anything above that is considered 'good'. Each entity is scored by averaging
5 weighted sub scores. When looking at your portfolio or multiple entities, the
score represents the average.
5 Weighted Sub Scores:
Frequency your brand is promoted (30%)
Quality of branded posts (25%)
Engagement on branded vs non-branded (25%)
Share of Voice your brand vs others (10%)
Post Proportion branded vs non-branded (10%)
Learn more
about the PE Score
Earned Media
------------------------------------------
Athletes,
team, league drives exposure and value for a brand via their owned social channels.
It can be argued that this is the ‘most’ valuable of brand exposure since it
is coming directly from the entity that a fan is following. Brands also get exposure
and value via their portfolio from channels that the athlete, team, league, etc.
do not control but where they are mentioned. This exposure is considered “Earned”
because the entity earned the mention - albeit for positive or negative actions.
So from this perspective, an "Owned" post is one that comes from an entities
social channel they control and an "Earned" post is one that the entity is promoted
or mentioned - one that includes an @ mention, # hashtag or keyword specific
to that entity.
Earned Promoters: In the case of Earned Media - a promoter is
an entity that promoted or mentioned another entity - for example if the PGA
talked about Jordan Spieth in a post by using either an @, # or keyword that
is mapped or related to him (e.g. #jordanspieth or "Jordan Spieth") - then they
are the Promoter. When looking at Jordan in your Portfolio report, the
number of Promoters are the unique number of Entities that talked about him (with
respect to date range or filters are set).
Earned Posts: An earned post is any that talk about anyone
in your portfolio (assuming Earned tracking is turned on for them). A
post can be both Owned and Earned - using the PGA and Jordan Spieth example -
if you sponsor both PGA and Jordan - the PGA post that mentions Jordan is both
Owned for PGA and Earned for Jordan. When looking at the Entities tab,
Earned Posts is the count of total post with respect to date range and filters
that talked about that entity.
Earned Interactions: The total likes, comments, shares
& reactions on the earned posts
Earned Video Views: The total video views, comments, shares
& reactions on the earned posts
Earned Branded Posts: The Earned Posts that include branding
/ promotion for the brands being valued in the report you are looking at.
Earned Branded Interactions: The likes, comments, shares
& reactions on the earned Posts that include branding / promotion for the
brands being valued in the report you are looking at.
Earned MAV: The MAV on the earned Posts that include branding
/ promotion for the brands being valued in the report you are looking at.
Earned Effective Promo Quality: The total AAV / MAV on
the earned Posts that include branding / promotion for the brands being valued
in the report you are looking at.
Earned Average Promo Quality: The average promotion quality
on the earned posts that include branding / promotion for the brands being valued
in the report you are looking at.
Earned AAV: The AAV on the earned Posts that include branding
/ promotion for the brands being valued in the report you are looking at.
Earned to Owned AAV Ratio: The Earned AAV divided by the
Owned AAV from an entity in your portfolio expressed as a %. So if an entity
drove $100K in AAV on their owned posts and their earned posts included $200K
of AAV, the Earned to Owned AAV Ratio would be 200%.
Owned + Earned AAV: Simply the entities Owned AAV + Earned
AAV, so the total value driven for the brand.
Can't find what you're looking for? Let us know at csm@hookit.com